It is extremely difficult to separate soil particles with a sieve if the particle size is less than 0.075.
As a result, a hydrometer is used to determine the particle size distribution of soil with particle sizes less than 0.075 mm.
The size of the soil particles determines how quickly they settle from a suspension.
As a result, the particle size distribution is obtained by settling soil particles from a suspension.
The test uses soil that has passed through a 0.425mm sieve, however the sample should not have been oven dried.
To determine the moisture content of a soil sample, a part of the same soil is oven dried.
The moisture content is then utilized to adjust the dry weight of the sample used for the test (referred to as hygroscopic moisture content).
This soil is precisely weighted at 50 grams, and 125 ml of sodium hexametaphosphate solution (40 g/liter) is added.
The mixture is properly soaked for at least 16 hours.
After adding a suitable amount of water, the soaked sample is transferred to a dispersion cup and disseminated further using a mechanical stirring apparatus.
Following dispersion, the soil-water slurry is transferred to a sedimentation cylinder and 1000 ml of distilled or demineralized water is added to it.
Shake the cylinder vigorously by turning it upside-down and back for about 1 minute, with the palm of your hand over the open end of the cylinder.
The cylinder is then put in a convenient area to acquire hydrometer readings with the hydrometer depicted in Figure 1.
Readings are taken every 0.5, 1 minute, 2 minutes, 4 minutes, 8 minutes, 15 minutes, 30 minutes, 1 hour, 2 hours, 4 hours, 8 hours, 16 hours, and 24 hours.
After the reading at 4 minutes, the hydrometer should be progressively removed, cleaned with water, and stored in a cylinder of distilled or demineralized water.
When taking a hydrometer reading, insert the hydrometer gently 30–45 seconds before the reading is due.
Following the reading, gently remove the hydrometer from the cylinder and put it in distilled or demineralized water instead of the one it came with.
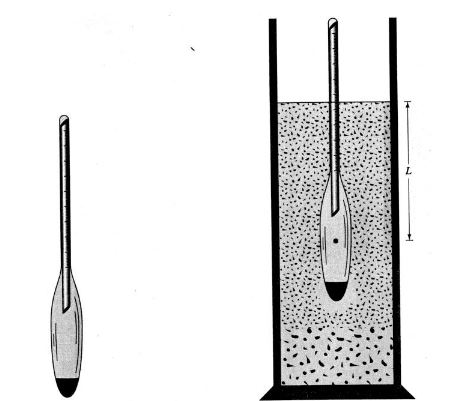
Table of Contents
Correction of Hydrometer readings
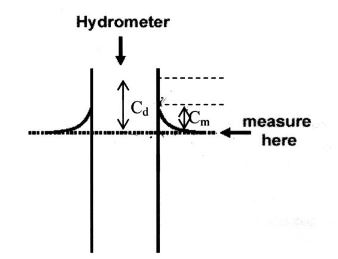
The hydrometer reading should be taken at the meniscus’s bottom.
This, however, is practically impossible due to the soil suspension.
As a result, the hydrometer reading is collected at the meniscus’s top and a meniscus correction (Cm) is applied, as seen in Figure 2.
This adjustment can be obtained by obtaining readings at the top and bottom of the meniscus after immersing the hydrometer in an identical solution produced without soil (in cylinder 2).
The meniscus correction is calculated as the difference between the top and bottom readings (Cm).
Similarly, the correction for dispersion agent (Cd) is calculated by obtaining a reading in cylinder 2.
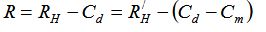
Assume that RH’ is the raw hydrometer reading. RH, the hydrometer measurement after meniscus adjustment, can be derived as follows:
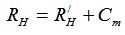
After applying both corrections, the corrected hydrometer reading can be obtained as follows:
Computations
Percentage of particles remaining in suspension
The proportion of suspended soil (P) at the density level being measured by the hydrometer can be calculated as follows:
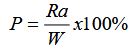
where;
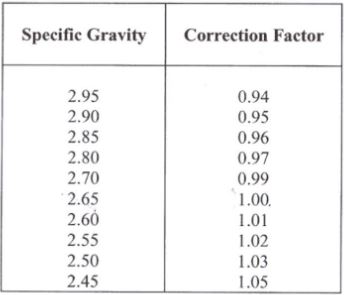
a = The correction to be applied as a result of particle specific gravity variations (Table 1).
R = Hydrometer reading after applying both corrections.
W = After applying the hydroscopic correction, the oven dried mass of the soil in suspension.
Table 1: Correction factor ‘a’ based on specific gravity of soil
Diameter of soil particles
The diameter (D) of the particles at the density level being measured by the hydrometer can be found from:

where;
K = a constant that relies on the suspension’s temperature and can be found in Table 2.
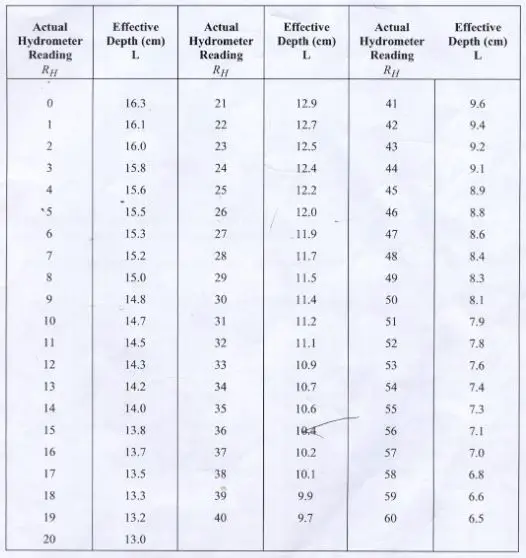
L = To be found from Table 3.
Table 2: Value of K
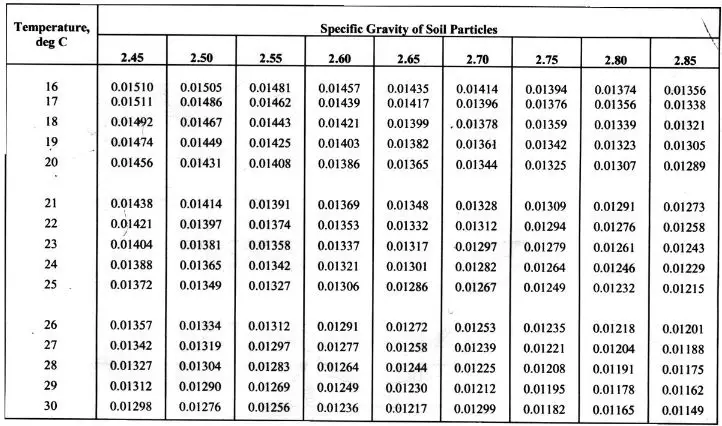
Table 3: Values of effective depth based on Hydrometer
After obtaining the diameter and percentage of particles, the particle size distribution curve can be plotted.
Watch the video below from Middle East Technical University’s Department of Civil Engineering for a practical demonstration of the test.
Related: What are the Basic Soil Tests?