Let’s learn about Atterberg Limits.
When fine-grained soils contain clay minerals, they can be remolded without crumbling in the presence of moisture. The adsorbed water surrounding the clay particles contributes to their cohesive nature. In the early twentieth century, a Swedish scientist named Atterberg created a method for describing the composition of fine-grained soils with changing moisture content.
Soil behaves more like a solid with extremely low moisture content. When the moisture level of the soil and water is extremely high, they can flow like liquids. Thus, arbitrary classifications of soil behavior based on their moisture content are possible: solid, semisolid, plastic, and liquid. Similarly, as illustrated in Figure 1, the volume of soil changes as the moisture content increases. As shown in Figure 1, the volume of soil stays the same and shrinks linearly when the moisture content exceeds the shrinkage limit.
The shrinkage limit is defined as the percentage of moisture in which a solid becomes semisolid. The moisture content at the transition point between semisolid and plastic is referred to as the plastic limit, whereas the moisture level at the transition point between plastic and liquid is referred to as the liquid limit.
The Shrinkage Limit (SL) is the moisture content below which no further soil volume loss (shrinkage) occurs.
The plastic limit (PL) is the quantity of moisture in the soil below which it exhibits non-plastic behavior.
The liquid limit (LL) is the moisture concentration below which the soil behaves as a plastic material. At this moisture content, the soil is on the point of becoming a viscous fluid.
The diagram below depicts the volume change of soil in relation to moisture content. ASTM D 4318 specifies the liquid, plastic, and shrinkage limits.
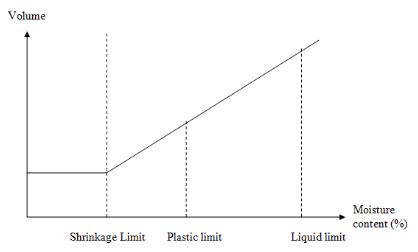
Table of Contents
Liquid Limit
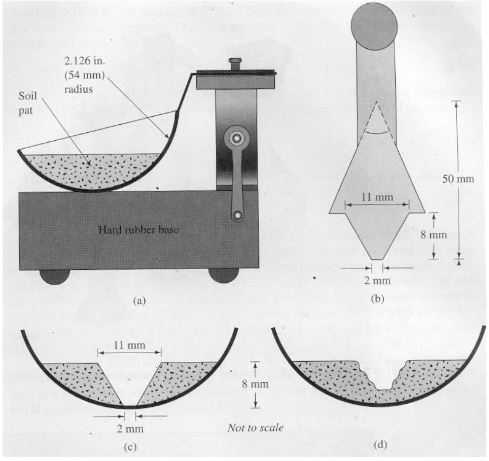
Figure 2 is a schematic diagram of a liquid limit device. This is composed of a brass cup and a tough rubber base. A cam that is turned by a crank can drop a metal cup onto the base. A soil component that passes the No. 40 sieve is used for the liquid limit test. The soil sample is combined with water to make a paste, which is then placed in the cup indicated in Figure 2. (a). The conventional grooving tool is used to cut a groove in the center of the soil pat as shown in Figure 2(b).
The cup is then raised and dropped at a rate of 2 blows per second using the crank-operated cam from a height of 10 mm. The number of blows required to close the groove over a distance of 12.7mm along the groove’s bottom is recorded, and the moisture content of the soil is measured.
The technique described above is repeated by adding additional moisture to the soil and mixing it thoroughly. Figure 3 illustrates a semi-logarithmic plot of the number of blows (N) versus the moisture content. The liquid limit is defined as the moisture level, expressed as a percentage, required to seal the groove at its bottom after 25 blows (LL).
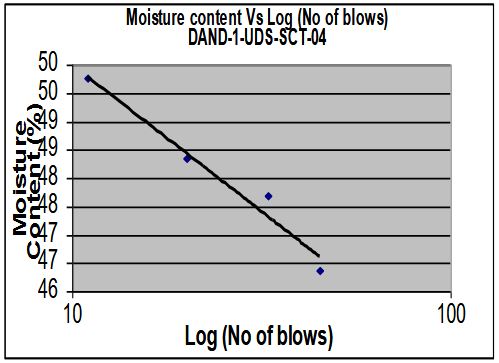
The flow curve is the straight line that connects moisture content Vs. log (number of blows).
The flow index, Ip, is the slope of the flow curve.
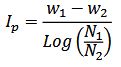
The Waterways Experiment Station in Vicksburg, Mississippi (1949) provided the following empirical formula based on a large number of liquid limit tests.
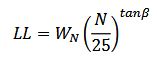
where;
N is the number of blows in the liquid limit device for 12.7m groove closure.
WN is the corresponding moisture content.
tan β is generally taken as 0.121.
When the number of blow counts, N, is between 20 and 30, the preceding equation produces accurate results. When only one laboratory test is conducted to determine the liquid limit, the above equation may be utilized to determine the LL. As a result, it is named the “one-point approach.”
Plastic Limit
The plastic limit is defined as the moisture content of the soil at which it crumbles when rolled into 3.2 mm threads (0.125 in.). Add enough water to the soil to make it easily moldable into peanut-sized soil balls. On a glass plate, place one of the soil balls and roll it between the fingers of one hand to make a thread of uniform diameter.
If the diameter of the soil thread reaches 3mm but does not crumble, break it into several small pieces, re-form it into a ball, and repeat the process until the soil thread crumbles when rolled to 3mm. When this occurs, remove the thread to determine its moisture level.
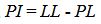
Plasticity Index;
The liquid index, LI, is a measure of a soil’s relative consistency in its natural condition.
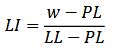
The natural moisture content is denoted by w.
LI > 1 is required for certain sensitive clays (w is more than LL). When remolded, these soils flow like liquid. Due to the fact that some stiff soils may have a natural moisture content of less than PL, the LI is negative.
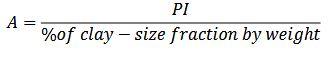
The PI rises with the percentage of clay size particles (particles smaller than 0.002mm), hence Activity A is defined as follows.
It has been discovered that the type of clay mineral contained in the clay influences the activity A. For example, illite A has a range of 0.5 to 1, whereas Kaolinite A has a range of about 0.5.
Read Also: An Introduction to Arches
Watch the video below from Missouri University of Science and Technology for a hands-on experience.